
| Home Catalog CCCP | Publications Collaboration | US mirror |
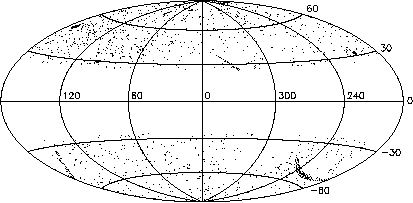
The 400d survey is based on the pointed observations with the ROSAT PSPC. It consists of 1610 fields around various targets at high Galactic latitudes. The catalog includes clusters detected in the central 17.5′ and excluding the area around the targets. The total geometric area is 397 square degrees.
The ROSAT pointings were selected by the following criteria
|

The distribution of the 400d fields in the Galactic
coordinates
|
Clusters are selected as spatially extended X-ray sources. The sophisticated detection algorithm is adopted from the 160d survey. This is a three-step procedure optimized for finding faint extended objects and separating them from point-like sources. As few as ~20 photons is usually sufficient to confidently detect a cluster!
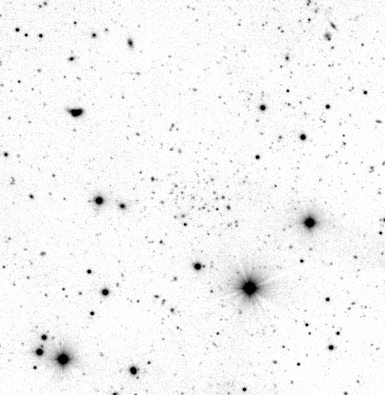
All X-ray detections were followed up in the optical. The cluster IDs were confirmed from imaging on 1–2m class telescopes. A few member galaxies in each cluster were then observed spectroscopically to determine the cluster redshift. Telescopes involved:
| Imaging: |
Spectroscopy: |

| extended X-ray sources | 287 |
| confirmed clusters | 266 |
| non-cluster extended sources | 5 |
| previously known redshifts | 175 |
| false detections | 16 |
For 16 objects, we were unable to find optical cluster counterparts even in very deep I band images. If these sources are clusters, they must be at z>1 where most of the galaxy light is redshifted into infrared. However, most likely they are false detections (confused point sources), as indicated by their X-ray morphology, and also by the overall agreement between the number of unidentified sources in the data and the number of false detections expected from the simulations.