|
Bright X-Ray pulsars with INTEGRAL |
 |
 |
X-ray pulsars:
- Main page
- Crab
- 4U 0115+63
- V 0332+53
- A 0535+262
- Vela X-1
- Cen X-3
- GX 301-2
- OAO 1657-415
- Her X-1
- GX 1+4
- EXO 2030+375
Useful Information:
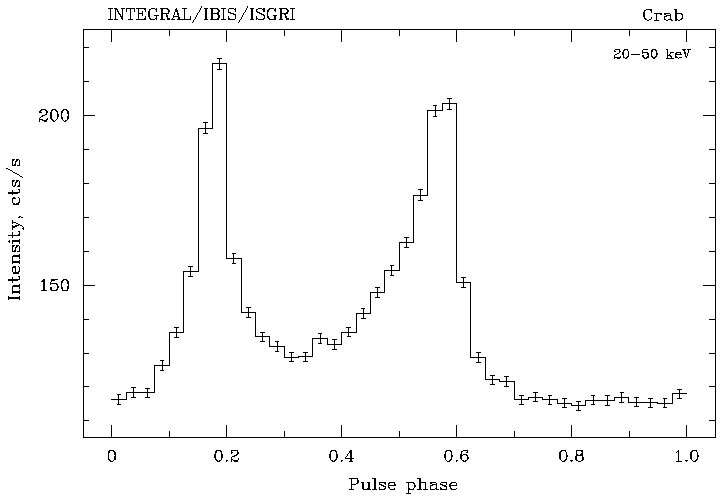
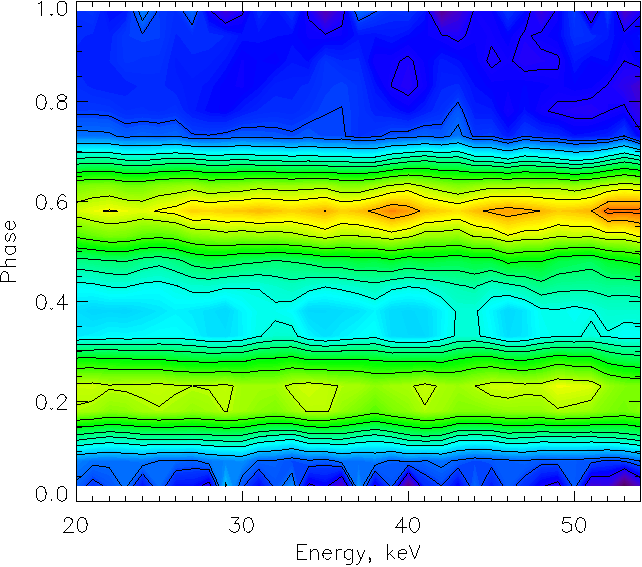
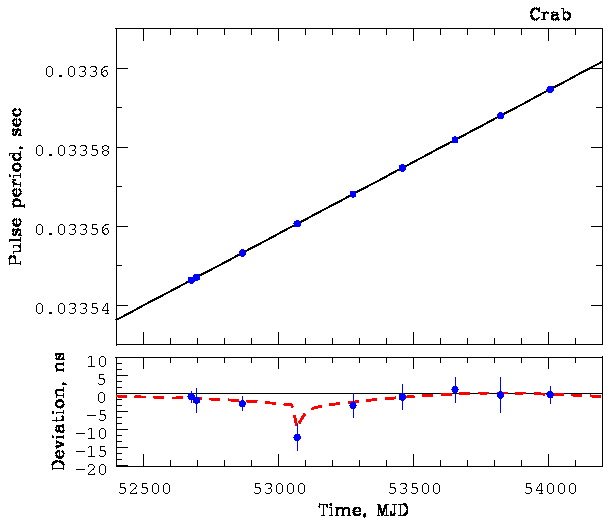
For the illustration of the INTEGRAL temporal analysis and applied method capabilities we present here an averaged (over 3 scw) pulse profile of the pulsar NP0532 in the Crab Nebula in 20-50 keV energy band, the relative intensity map in "energy-pulse phase" coordinates and the time dependence of its pulse period (from top to bottom, respectively):


At the upper panel of the last figure period measurements from INTEGRAL data are shown by filled circles; the solid line represents an extrapolation of the Jodrell Bank radio measurements. At the bottom panel the corresponding deviations of the INTEGRAL measurements from this extrapolation (filled circles) and the radiomeasurements (dashed line) is shown. In both ranges, a glitch is clearly seen at MJD 53070.