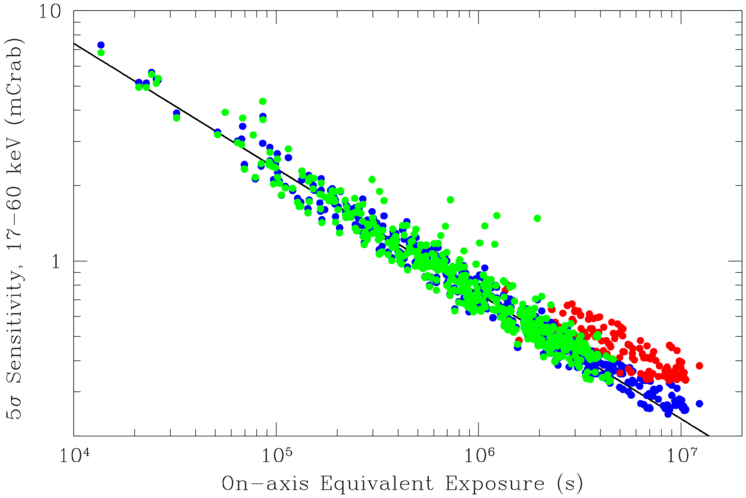
| Measured 5σ limiting flux for catalogued source positions on the final total average all-sky map, as a function of
effective dead-time corrected exposure time. The blue points reflect nominal sensitivity changing with exposure by 1/sqrt(T) as expected. The solid line represents the fit to the nominal sensitivity versus exposure. The green and red points are 5σ actual sensitivity taking into account background variations in the field of each 20x20 sky projection (see paper). The sensitivity measured in (and out of) sky region |l|<20 deg and |b|<15 deg is shown in red (green). |


